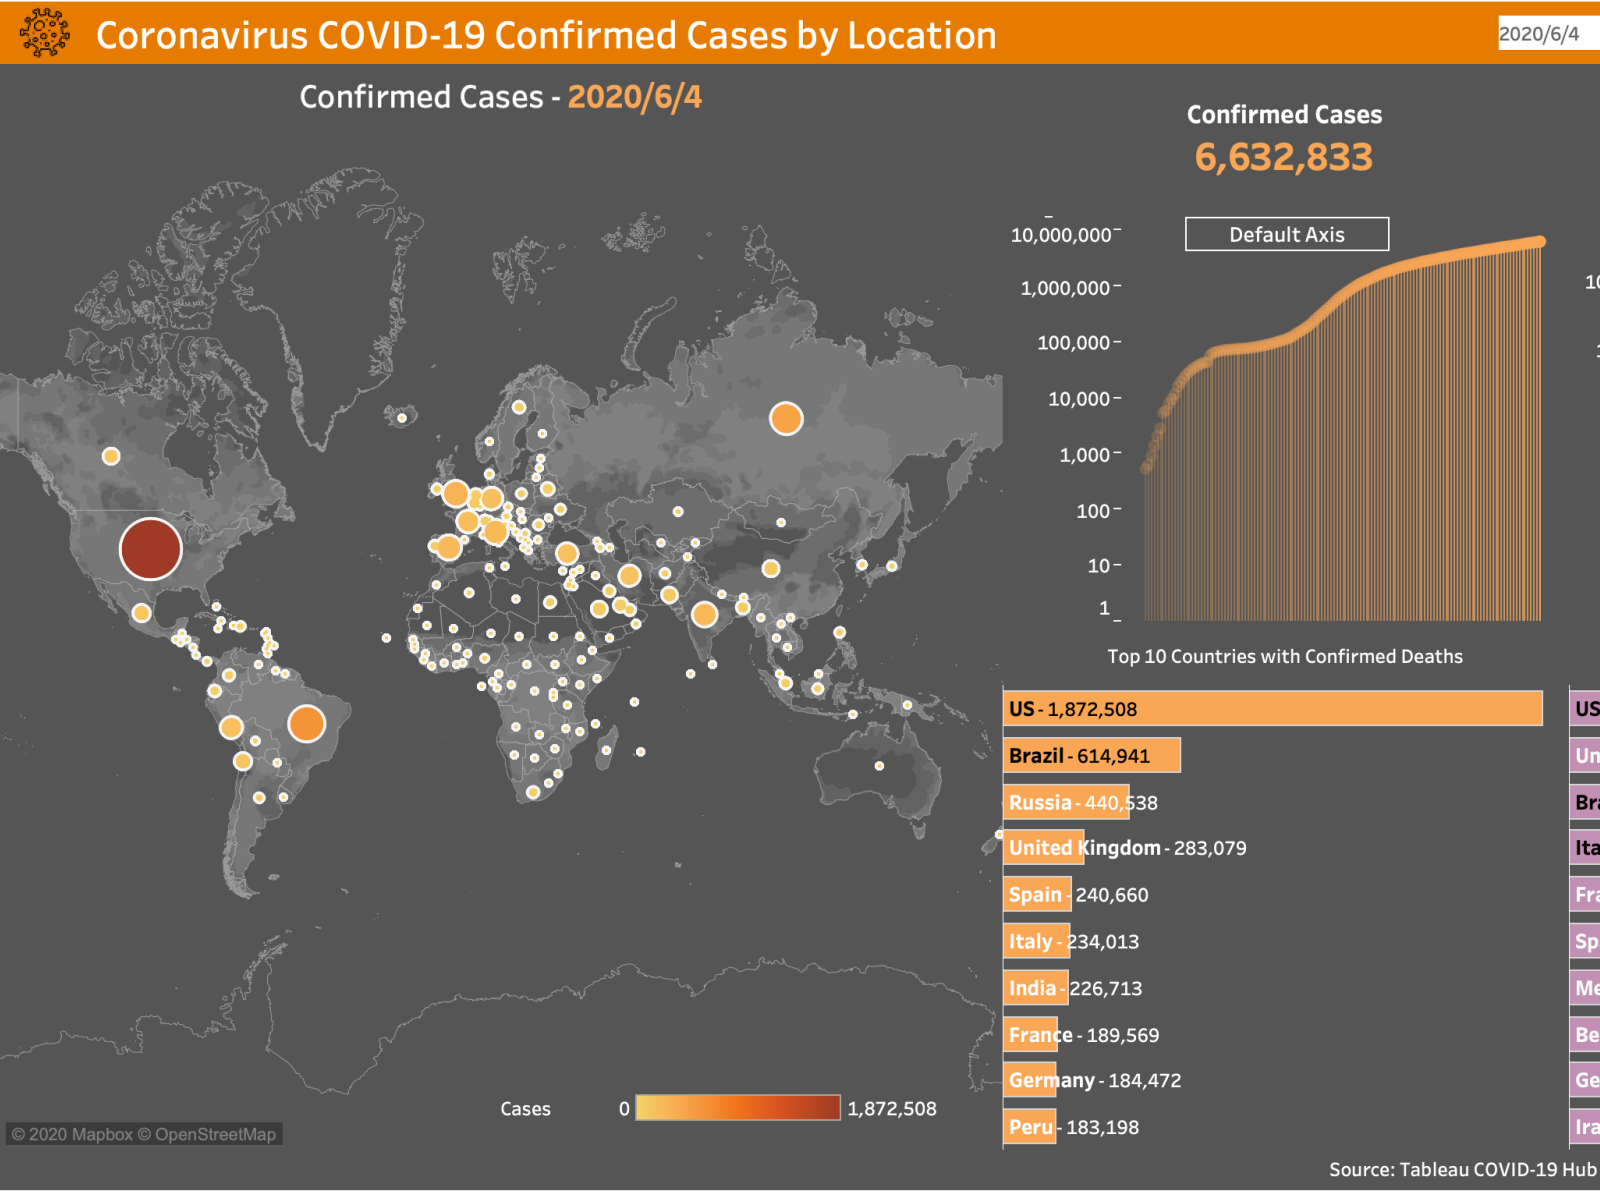
This is the worksheet for COVID-19 Confirmed Case by Location, using the map, line chart, bar race to show the distribution of different cases in the worldwide and help visualize the growths.
Inspired by Anthony B. Smoak❤
You can view the animation on https://public.tableau.com/profile/winnie.wu#!/vizhome/COVID-19ConfirmedCasebyLocation/Dashboard2
>>访问dribbble查看高清大图
做人要厚道,转载请注明文章来源:
https://www.boxui.com/ued/ui-design-ued/43479.html


评论回复